Market conditions are often tracked through reports, spreadsheets, and manual checks across many online sources, with data updates at different intervals. Collection methods vary by person. Metrics are interpreted differently across departments. As a result, organisations struggle with inconsistent visibility, duplicated effort, and delayed decisions.
Custom analytics dashboards bring these activities into a single structured system. Instead of repeatedly gathering external information, specific market signals are defined and displayed in dashboards that automatically update as new data becomes available. In this way, teams access the same metrics, based on the same data, with the same definitions.
To address this challenge, this guide explains how custom analytics dashboards supported by automated data extraction maintain consistent visibility into external business conditions.
It covers data sourcing, extraction pipelines, KPI construction, dashboard design, operational challenges, and practical implementation approaches.
What Is A Custom Analytics Dashboard?
A custom analytics dashboard is a purpose-built interface that converts structured data into continuously updated visual insight. Unlike generic reporting templates, custom dashboards are designed around specific business questions and decision workflows.
They centralise key performance indicators into a single view and present them through interactive charts, tables, filters, role-based views, and alerts that reflect real operational needs. In contrast to static reports, these dashboards evolve as new data arrives and as business priorities shift.
Core capabilities include centralised KPI tracking, interactive exploration, drill-down analysis, user-specific views, and automated notifications when defined conditions change. As a result, dashboards become active decision tools rather than passive reporting screens.
Practical benefits include:
- Faster decisions based on continuously updated information
- Reduced manual research and reporting effort
- Shared metric definitions across departments
Update frequency plays a critical role. Real-time dashboards reflect changes as data is collected. This is essential for monitoring price movements, stock availability, rankings, or fast-moving trends. Scheduled dashboards refresh at planned intervals and work well for trend analysis and periodic planning.
Why Custom Analytics Dashboards Are Adopted
Standard analytics tools typically focus on internal or historical data. Many strategic decisions depend on external signals such as competitor behaviour, pricing changes, rankings, reviews, job postings, product availability, and market movement.
Traditional reports do not provide continuous visibility into these external conditions. Manual tracking is time-consuming and inconsistent, and difficult to scale across teams. Because of this, decision-making often relies on partial or outdated information.
Custom analytics dashboards fill this gap by bringing external signals into structured decision environments where they can be monitored, compared, and acted upon without repetitive manual collection.
What Makes an Analytics Dashboard Truly Custom
Custom Analytics dashboards are defined by alignment to real decisions rather than visual styling alone. A custom dashboard is designed backwards from specific questions, such as:
- Which competitor changed pricing today
- Which products lost ranking in a key category
- Which locations show rising demand signals
Customisation happens across three layers.
To support these decisions, customisation happens across the following layers:
- External data sourcing through web scraping and APIs that continuously collect public data
- Data structuring and normalisation to clean, deduplicate, and align records across sources
- KPI and visualisation logic built around defined decisions rather than generic metrics
When all three layers are aligned, dashboards function as decision tools rather than reporting screens.
Where Dashboard Data Comes From in Modern Setups
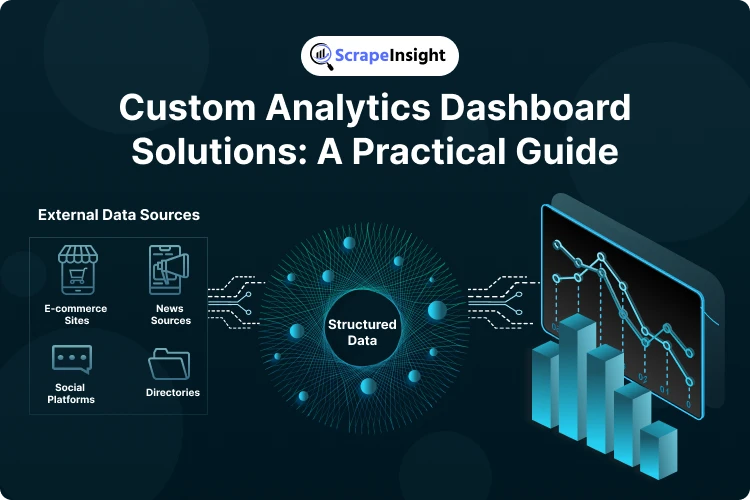
Modern custom dashboards rely heavily on public and external data sources. These include marketplaces, e-commerce sites, directories, review platforms, news sources, job boards, and social platforms. These environments contain competitive and market signals that are not available in internal datasets.
At scale, maintaining this flow of external information requires a robust foundation, which is why enterprise web scraping data engines are used to continuously collect, monitor, and standardise data across multiple sources.
Continuous extraction pipelines automatically collect and refresh this information. Real-time or scheduled update cycles ensure dashboards reflect current conditions as external environments change. Extracted data is stored in structured formats, so dashboards query stable datasets rather than raw web pages.
How Web Scraping and Data Extraction Power Dashboards
Web scraping and automated data extraction transform unstructured web pages into structured datasets. This allows large volumes of public data to be collected without manual browsing.
The process begins by identifying target pages and required data fields. Extraction systems collect the data at defined schedules. Monitoring processes detect when website structures change so extraction rules can be adjusted. Cleaned and normalised datasets are stored in databases where analytics layers calculate metrics and trends.
Refresh frequencies vary based on business needs. Some dashboards update in near real time for pricing or availability tracking. Others refresh hourly or daily for trend and performance analysis. Reliable extraction monitoring ensures dashboards remain consistent and accurate over time.
To explore more advanced use cases, including predictive insights and intelligent analytics, see our guide on How to Build an AI-Powered Dashboard from Web Scraped Data, which explains how extracted datasets can be transformed into decision-ready dashboards.
From Raw Web Data to Dashboard Metrics
Turning extracted web data into dashboard-ready metrics follows a clear sequence.
Sources are selected, and required fields are mapped. Extraction pipelines collect data at scale. Cleaning and deduplication remove inconsistencies. Entity matching aligns products, brands, or listings across multiple sources.
Calculated metrics and trend indicators are built on top of structured records. Visualisation layers present comparisons, changes, and alerts that support specific decisions.
Documenting KPI definitions and calculation logic ensures shared understanding and consistency across stakeholders.
How Dashboards Are Approached in Practice
Effective dashboard initiatives begin by defining decisions before designing charts. A small set of high-value KPIs tied directly to business actions is selected first. A minimum scope dashboard is then built to support those tasks.
Once extraction pipelines are stable and dashboards prove useful, additional sources and metrics are added through controlled iterations. This approach avoids unnecessary complexity and ensures dashboards earn adoption through practical use rather than visual appeal alone.
Measuring Dashboard Effectiveness
Dashboard value is measured through outcomes rather than visual design.
Key indicators include:
- Faster reaction to market changes
- Reduced manual data collection time
- Consistent data freshness and accuracy
- Regular usage across decision makers
When dashboards become part of routine decision processes and manual tracking declines, the implementation is successful.
Common Challenges and Realistic Handling
- Website layout changes can disrupt extraction. Continuous monitoring and rapid adjustment workflows keep pipelines stable.
- Data inconsistencies across sources require normalisation logic and entity matching to maintain reliable comparisons.
- Overcollection of data without defined KPIs leads to dashboards that overwhelm users. Anchoring every metric to a real decision prevents this issue.
Planning for these challenges early ensures dashboards remain reliable and relevant over time.
ScrapeInsight as the Data Backbone for Custom Analytics Dashboards
Custom analytics dashboards are only as reliable as the data feeding them. When extraction pipelines fail, dashboards show gaps, outdated values, or inconsistent records. Source websites change often, page structures shift, and data formats evolve, which makes unmanaged scraping scripts difficult to maintain over time.
ScrapeInsight was built to solve this exact problem. Instead of offering scraping tools that require constant internal maintenance, it delivers managed web data extraction with continuous monitoring, data cleaning, normalisation, and structured dataset delivery.
This ensures that external data flows into analytics environments consistently, without the need to manage scrapers, proxies, or frequent parser fixes.
Beyond data extraction, ScrapeInsight supports organisations in building custom analytics dashboards on top of external data. This enables faster movement from raw data to practical, decision-ready insights.
For organisations developing external data-driven analytics, this combined approach keeps pipelines stable, reduces technical workload, and accelerates deployment. Focus remains on decisions and insights while ScrapeInsight handles extraction and dashboard implementation.
Explore how ScrapeInsight can support your data and dashboard requirements.