Building dashboards is not always as simple as it seems. When your data comes from the web, you can’t just drop it into a chart. You’re dealing with missing fields, inconsistent formatting, duplicate entries, and data that changes depending on how or when it’s scraped. This is a common problem for developers and analysts working with scraped data.
In this guide, you’ll learn how to build an AI-powered web scraping dashboard from start to end. We’ll use ChatGPT to generate the dashboards. By the end, you will have a working dashboard with meaningful insights and charts.
Why Use ChatGPT to Build a Dashboard?
Scraped data is rarely clean. To visualize it, you often need to clean missing values, align formats, and reshape the structure. Instead of manually writing Python scripts, you can now describe your intent in plain English and let ChatGPT generate the code for you.
ChatGPT can:
- Extract and normalize fields
- Restructure your data
- Recommend chart types
- Write full dashboard apps using frameworks like Streamlit
Example Use Case
Let’s say you are comparing noise-canceling headphones on Amazon.
- First, you scrape the search results to get product names, prices, ratings, and URLs.
- Then, you scrape individual product pages for specifications such as battery life, active noise cancellation support, and wireless features.
Now you have two layers of data: one broad and one detailed, but with inconsistent formats. ChatGPT helps you combine and structure everything so you can build a dashboard.
Let’s go ahead with this example.
Building the AI-Powered Dashboard with ChatGPT
Once your structured data is ready, the next step is turning it into a functional dashboard. This is where ChatGPT becomes useful. You can describe the structure, layout, or visualizations you want using plain language, and ChatGPT will generate the code to meet your needs.
There are two ways to use ChatGPT to create the dashboard:
- Using the OpenAI API.
- Uploading your data directly into the ChatGPT interface
Method 1: Using the OpenAI API
If you want to automate dashboard generation or make it repeatable, the OpenAI API is a suitable option. To get started, make sure you have the OpenAI SDK installed:
pip install openai
Set your API key securely using environment variables:
export OPENAI_API_KEY="sk-xxxxxxxxxxxxxxxxxxxxxxxxxxxxxxxxxxxx"
Next, load your JSON file and send a structured prompt to GPT-4 asking it to create a dashboard script. Here is a full Python script:
import os
import json
from openai import OpenAI

client = OpenAI(api_key=os.getenv("OPENAI_API_KEY"))

with open("product_details.json", "r", encoding="utf-8") as f:
    product_data = json.load(f)

sample = json.dumps(product_data[:15], indent=2)

prompt = f"""
You are a Python developer. I scraped product data from Amazon. The data includes fields like title, brand, price, original price, discount, rating, reviews, image, features, and URL.

Here is a sample:

{sample}

Now generate a complete dashboard script in Python using one of the following frameworks: Streamlit, Plotly Dash, or Flask. Choose whichever is best suited for interactive charts and filtering.

The dashboard should include:
1. A title section
2. Summary metrics: total products, average price, average rating, and max discount
3. A rating summary table grouped by rating, with product count, average price, average discount, and average reviews
4. A horizontal bar chart of top 10 brands by product count
5. A scatter plot of price vs reviews, with rating as the bubble size
6. A product table with clickable titles that link to the product URL
7. A gallery view showing the product image, title, price, rating, features, and link

Use pandas and plotly.express where appropriate. Output only valid Python code.
"""

response = client.chat.completions.create(
    model="gpt-4",
    messages=[
        {"role": "user", "content": prompt}
    ],
    temperature=0.3
)

generated_code = response.choices[0].message.content

with open("dashboard.py", "w", encoding="utf-8") as f:
    f.write(generated_code)

print("Dashboard script saved to dashboard.py")
Once the code is saved, run the script locally using the framework chosen by you. For example, if you chose Streamlit:
streamlit run dashboard.py
This method is particularly useful when building custom dashboards at scale or integrating into a larger data pipeline.
Method 2: Using ChatGPT Directly
Alternatively, you can upload the product_details.json file into the ChatGPT interface and describe what kind of dashboard you want. You might ask:
I scraped data from Amazon. Can you build a dashboard that shows:
- Summary metrics for price, rating, and discount
- A rating summary table grouped by rating
- A bar chart of the top brands
- A table with clickable product titles
- A product gallery with images, specs, and a link
You can ask for a dashboard in Streamlit, HTML, or another tool you’re using. ChatGPT will write a full script based on your prompt. You can refine it further by asking for changes, such as:
- Add filters for price and brand
- Change the layout or chart types
- Add sorting to the table or pagination to the gallery.
Once you’re happy with the output, save the code and run it locally.
Here’s the Code for the Dashboard I Made Using ChatGPT
ChatGPT generated this Streamlit dashboard based on structured Amazon product data collected.
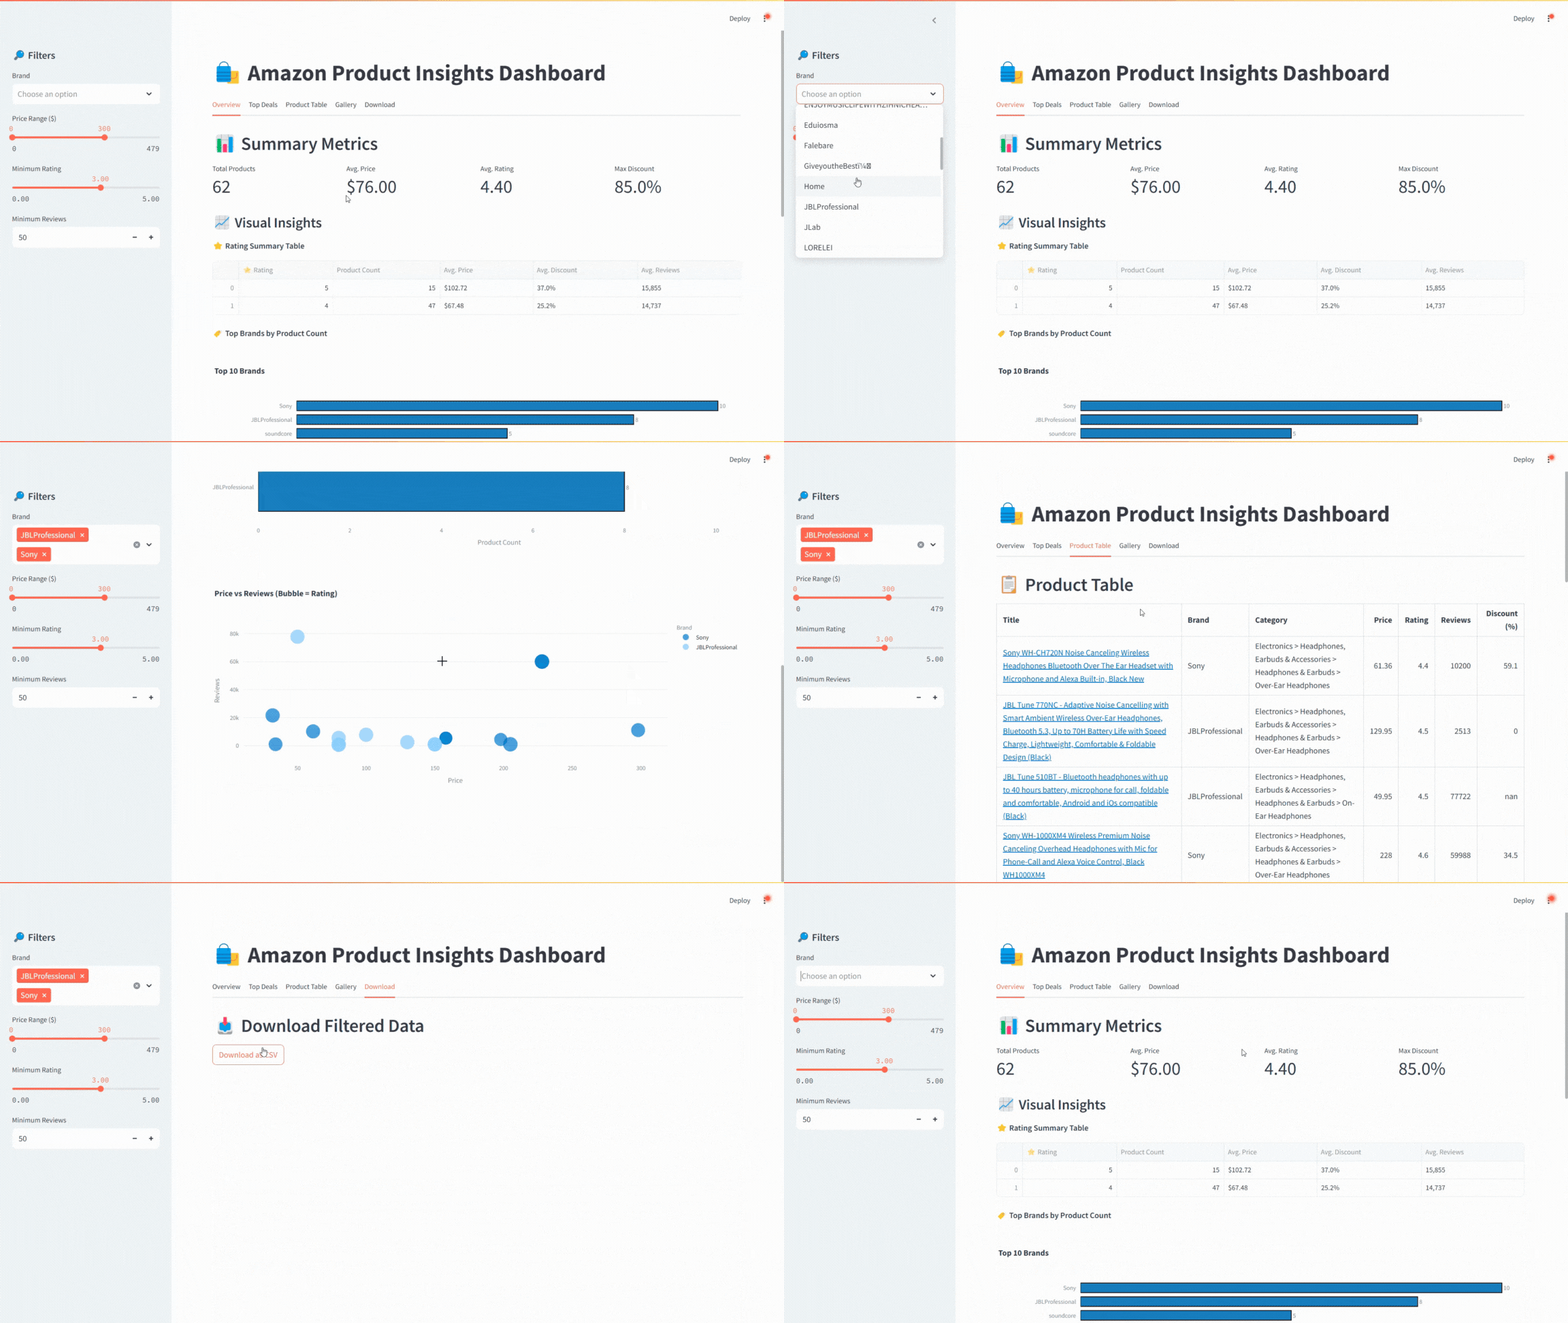
This dashboard allows users to:
- Filter products by brand, price range, rating, and review count.
- Analyze detailed product tables and identify top deals.
- It includes a rating table, a brand bar chart, and a price vs. reviews scatter plot.
- A gallery view with images, feature highlights, and pricing details.
- An export option to download the filtered dataset as a CSV file.
Complete Streamlit Dashboard Script
import streamlit as st
import pandas as pd
import json
import re
import plotly.express as px
import numpy as np

# Load JSON
with open("product_details.json", "r", encoding="utf-8") as f:
    raw_data = json.load(f)

# Helper functions
def parse_price(price):
    try:
        return float(re.sub(r"[^\d.]", "", str(price)))
    except:
        return None

def parse_rating(rating):
    try:
        return float(str(rating).split()[0])
    except:
        return None

# Flatten and clean the data
data = []
for entry in raw_data:
    product = entry.get("body", {})
    if product:
        price = parse_price(product.get("price"))
        original_price = parse_price(product.get("originalPrice") or product.get("original_price"))
        discount = round(((original_price - price) / original_price) * 100, 1) if price and original_price else None
        rating = parse_rating(product.get("rating") or product.get("customerReview"))
        reviews = product.get("customerReviewCount") or product.get("ratingCount")
        category = " > ".join(bc["name"] for bc in product.get("breadCrumbs", [])) or "Uncategorized"

        data.append({
            "Title": product.get("name") or product.get("title"),
            "Brand": product.get("brand"),
            "Price": price,
            "Original Price": original_price,
            "Discount (%)": discount,
            "Rating": rating,
            "Reviews": int(reviews) if isinstance(reviews, (int, float, str)) and str(reviews).isdigit() else None,
            "Deal Badge": product.get("dealBadge"),
            "Category": category,
            "Images": product.get("images", []),
            "Main Image": product.get("mainImage"),
            "URL": product.get("canonicalUrl") or product.get("url"),
            "Features": product.get("features", []),
            "Sold By": product.get("soldBy", {}).get("name"),
        })

df = pd.DataFrame(data).dropna(subset=["Title"])

# App layout
st.set_page_config(layout="wide")
st.title(" Amazon Product Insights Dashboard")

# Sidebar filters
st.sidebar.header(" Filters")
brands = st.sidebar.multiselect("Brand", sorted(df["Brand"].dropna().unique()))
min_price, max_price = st.sidebar.slider("Price Range ($)", 0, int(df["Price"].max()), (0, 300))
min_rating = st.sidebar.slider("Minimum Rating", 0.0, 5.0, 3.0, step=0.1)
min_reviews = st.sidebar.number_input("Minimum Reviews", min_value=0, max_value=100000, value=50)

# Apply filters
filtered = df.copy()
if brands:
    filtered = filtered[filtered["Brand"].isin(brands)]
filtered = filtered[(filtered["Price"] >= min_price) & (filtered["Price"] <= max_price)]
filtered = filtered[(filtered["Rating"] >= min_rating) & (filtered["Reviews"] >= min_reviews)]

# Tabs
tabs = st.tabs(["Overview", "Top Deals", "Product Table", "Gallery", "Download"])

# ----------------------- TAB 1: Overview -----------------------
with tabs[0]:
    st.header(" Summary Metrics")
    col1, col2, col3, col4 = st.columns(4)
    col1.metric("Total Products", len(filtered))
    col2.metric("Avg. Price", f"${filtered['Price'].mean():.2f}")
    col3.metric("Avg. Rating", f"{filtered['Rating'].mean():.2f}")
    col4.metric("Max Discount", f"{filtered['Discount (%)'].max() or 0:.1f}%")

    st.subheader(" Visual Insights")

    # Rating Summary Table
    st.markdown("** Rating Summary Table**")
    filtered["Rating Bucket"] = (
        filtered["Rating"]
        .dropna()
        .apply(lambda x: int(round(x)))
    )

    rating_summary = (
        filtered.groupby("Rating Bucket")
        .agg(
            Product_Count=("Title", "count"),
            Avg_Price=("Price", "mean"),
            Avg_Discount=("Discount (%)", "mean"),
            Avg_Reviews=("Reviews", "mean")
        )
        .sort_index(ascending=False)
        .reset_index()
    )

    rating_summary["Avg_Price"] = rating_summary["Avg_Price"].apply(lambda x: f"${x:.2f}")
    rating_summary["Avg_Discount"] = rating_summary["Avg_Discount"].apply(lambda x: f"{x:.1f}%")
    rating_summary["Avg_Reviews"] = rating_summary["Avg_Reviews"].apply(lambda x: f"{int(x):,}")

    st.dataframe(rating_summary.rename(columns={
        "Rating Bucket": " Rating",
        "Product_Count": "Product Count",
        "Avg_Price": "Avg. Price",
        "Avg_Discount": "Avg. Discount",
        "Avg_Reviews": "Avg. Reviews"
    }))

    # Top Brands
    st.markdown("** Top Brands by Product Count**")
    brand_counts = (
        filtered["Brand"]
        .dropna()
        .value_counts()
        .head(10)
        .reset_index()
    )
    brand_counts.columns = ["Brand", "Count"]

    fig_brand = px.bar(
        brand_counts,
        x="Count",
        y="Brand",
        orientation="h",
        title="Top 10 Brands",
        text="Count",
        color_discrete_sequence=["#1f77b4"]
    )
    fig_brand.update_traces(
        textposition="outside",
        marker_line_color="black",
        marker_line_width=1.5
    )
    fig_brand.update_layout(
        xaxis_title="Product Count",
        yaxis_title=None,
        bargap=0.3,
        yaxis=dict(autorange="reversed")
    )
    st.plotly_chart(fig_brand, use_container_width=True)

    # Price vs Reviews Scatter
    scatter = px.scatter(
        filtered,
        x="Price",
        y="Reviews",
        size="Rating",
        color="Brand",
        hover_name="Title",
        title="Price vs Reviews (Bubble = Rating)"
    )
    st.plotly_chart(scatter, use_container_width=True)

# ----------------------- TAB 2: Top Deals -----------------------
with tabs[1]:
    st.header(" Top 10 Deals")
    top_deals = filtered.sort_values(by="Discount (%)", ascending=False).head(10).copy()
    top_deals["Title"] = top_deals.apply(lambda x: f"[{x['Title']}]({x['URL']})", axis=1)
    top_deals_display = top_deals[["Title", "Brand", "Price", "Original Price", "Discount (%)", "Rating", "Reviews"]]
    st.write(top_deals_display.to_markdown(index=False), unsafe_allow_html=True)

# ----------------------- TAB 3: Product Table -----------------------
with tabs[2]:
    st.header(" Product Table")
    table_df = filtered.copy()
    table_df["Title"] = table_df.apply(lambda x: f"[{x['Title']}]({x['URL']})", axis=1)
    table_display = table_df[["Title", "Brand", "Category", "Price", "Rating", "Reviews", "Discount (%)"]]
    st.write(table_display.to_markdown(index=False), unsafe_allow_html=True)

# ----------------------- TAB 4: Gallery -----------------------
with tabs[3]:
    st.header(" Product Gallery")
    for _, row in filtered.iterrows():
        with st.expander(row["Title"][:100]):
            st.markdown(f"**Brand:** {row['Brand']} | **Sold By:** {row['Sold By'] or 'N/A'}")
            st.markdown(f"**Price:** ${row['Price']} | **Original:** ${row['Original Price']} | **Discount:** {row['Discount (%)']}%")
            st.markdown(f"**Rating:** {row['Rating']}  | **Reviews:** {row['Reviews']}")
            if row["Deal Badge"]:
                st.success(f" {row['Deal Badge']}")
            if row["Features"]:
                st.markdown("**Key Features:**")
                for feat in row["Features"][:5]:
                    st.markdown(f"- {feat}")
            if row["Main Image"]:
                st.image(row["Main Image"], width=200)
            elif row["Images"]:
                st.image(row["Images"][0], width=200)
            if row["URL"]:
                st.markdown(f"[ View on Amazon]({row['URL']})")

# ----------------------- TAB 5: Download -----------------------
with tabs[4]:
    st.header(" Download Filtered Data")
    csv = filtered.to_csv(index=False)
    st.download_button("Download as CSV", csv, "filtered_products.csv", "text/csv")
From Structured Data to Ready-Made Dashboards
Collecting and organizing web data is only the first step. The real challenge is turning that data into insights you can act on. ScrapeInsight does both. Our team handles the scraping, structures the data, and delivers dashboards tailored to your business goals.
This means you do not need to worry about cleaning data, coding visualizations, or connecting tools. You get clear AI-powered dashboards that help you track competitors, monitor trends, and report on changes over time without the heavy lifting.
Work with ScrapeInsight to go from raw web data to decision-ready dashboards in one step.