Subway Store Locations: Data Analysis of 20,009 Stores Across the USA
Explore 20,009 Subway stores across the US. See top states, top cities, coverage gaps and a map of every location. Get the full dataset.
 3 min read
 November 2, 2026


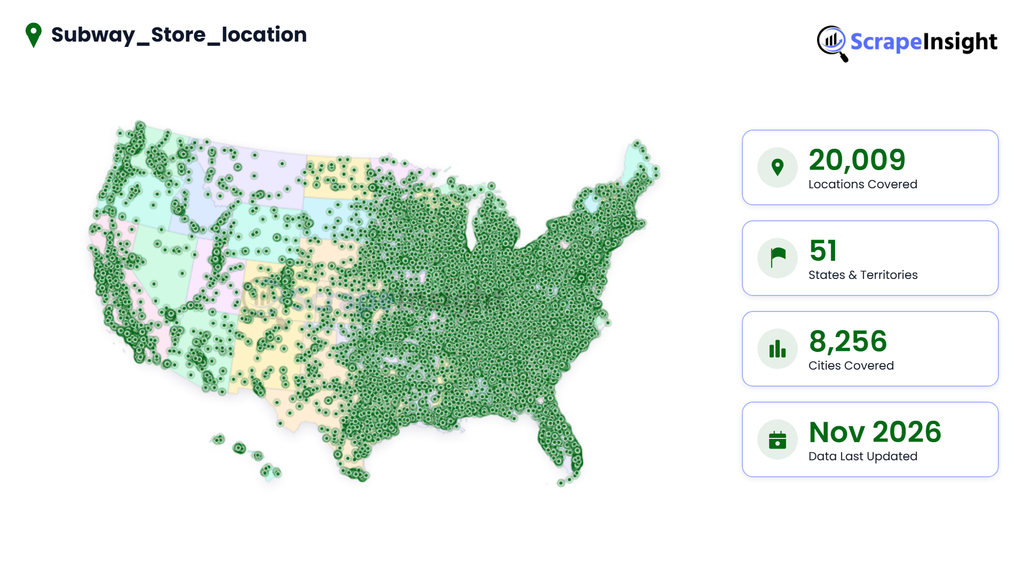
Subway reaches shoppers in big city centres and small towns alike. This dataset tracks 20,009 Subway stores, from Texas and California, where the network is densest, to territories where the brand has no store at all.
Below is the full dataset, organised by state, by city, and by the coverage gaps that remain.
Where are Subway stores located across the US?
Each dot is one Subway store. The network is heaviest in California, Texas and Florida. It also runs deep through the Midwest and Great Lakes, with strong counts in Ohio, Illinois and Michigan.
Top 10 states with the most Subway stores
The top ten states hold 50.5% of all Subway stores. Population explains most of the order, but not all of it. Ohio ranks fourth by count, yet it is first by density, with about 78 stores per million residents. Michigan and Illinois follow at about 72 and 69. New York is the outlier at about 36 per million, less than half of Ohio’s rate.
| Rank | State | Store Count | Population |
|---|---|---|---|
| 01 | California | 1,942 | 39.5M |
| 02 | Texas | 1,818 | 29.1M |
| 03 | Florida | 1,138 | 21.5M |
| 04 | Ohio | 919 | 11.8M |
| 05 | Illinois | 883 | 12.8M |
| 06 | New York | 734 | 20.2M |
| 07 | Michigan | 726 | 10.1M |
| 08 | Georgia | 688 | 10.7M |
| 09 | North Carolina | 647 | 10.4M |
| 10 | Pennsylvania | 611 | 13.0M |
Together, the top three states hold 4,898stores, 24.5% of the network.
Which cities have the highest number of Subway stores?
Two of the three biggest cities are in Texas. The ten biggest cities hold 1,036 stores, 5.2% of the network.
Density changes the ranking. Baltimore has 64 stores, the same as New York City, with about one fifteenth of the population. Miami has about 179 stores per million people, the highest in the top ten, and Las Vegas has about 140. Visitor traffic likely adds to both. Los Angeles has about 27 per million, which is low for its count.
| Rank | City | State | Store Count | Population |
|---|---|---|---|---|
| 01 | Houston | Texas | 199 | 2.3M |
| 02 | Chicago | Illinois | 180 | 2.7M |
| 03 | San Antonio | Texas | 114 | 1.5M |
| 04 | Los Angeles | California | 101 | 3.8M |
| 05 | Las Vegas | Nevada | 90 | 641.9K |
| 06 | Miami | Florida | 87 | 487.0K |
| 07 | Indianapolis | Indiana | 71 | 887.6K |
| 08 | Phoenix | Arizona | 66 | 1.7M |
| 09 | New York | New York | 64 | 8.8M |
| 10 | Baltimore | Maryland | 64 | 585.7K |
Subway’s coverage gaps in US states and territories
Subway covers 51 of 56 states and territories. The five with no store in this dataset are all territories. Puerto Rico (3.3M) is the largest gap by far. It makes up about 91% of the roughly 3.6M residents without a store. Guam, the U.S. Virgin Islands, American Samoa and the Northern Mariana Islands are far smaller markets.
| Rank | Territory | Population | Store Count | Opportunity |
|---|---|---|---|---|
| 01 | Puerto Rico | 3.3M | 0 | High |
| 02 | Guam | 153.8K | 0 | Potential |
| 03 | U.S. Virgin Islands | 87.1K | 0 | Potential |
| 04 | American Samoa | 49.7K | 0 | Potential |
| 05 | Northern Mariana Islands | 47.3K | 0 | Potential |
Opportunity is based on population: High above 1.5M residents, potential below.